Table of Contents
Coral Community
Ecological Survey
Photography of Fixed Sites
Coral Community in the Coral Reef Reserve Lagoon
Mobile Invertebrates Survey
Metabolic Function of the Coral Reef
Macroalgae Growth on the Reef
Coastal Environment Monitoring
Coastal Waters
Sandy Seafloor
Open Water Monitoring
Continuous Measurements
Chlorophyll Near the Reef
Surface Water Temperature in the Coral Beach Reserve
Current Measurements
Coral Community
Ecological Survey
Objective
Estimate the impact, the "health" status, and the structure of the coral community in the three main reefs along the coast of Israel in the northern Gulf of Eilat. The coral community survey included hard corals, soft corals, and invertebrates. In addition, a survey of the seafloor types (substrates) was conducted to estimate the potential for settlement at each site.
Methods
The coral community was sampled at three different sites, at various depths, as detailed in Table 1. The coral community survey is conducted once a year, during the summer period.
Table 1: Sampling Sites and Depths for Transect Cuts during Summer 2005
| Site |
Symbol |
Latitude |
Longitude |
Depths (m) |
| Inter-University Institute (Marine Lab) |
IUI |
34º55.02 |
29º30.07 |
5, 10, 15 |
| Closed Reserve (Japanese Gardens) |
NR |
34º55.26 |
29º30.33 |
5, 10, 20 |
| "A" (Between the Piers) |
KATZAA |
34º56.04 |
29º31.37 |
10, 20 |
The coral community survey was conducted using the transect method developed by Loya et al. (1972). At each geographical site, a measuring tape was laid from a random starting point along a depth transect, as specified in Table 1. The starting point of the transect was chosen randomly using a random number generator. From this point, consecutive 10-meter segments were made, separated by a few meters. The number of transects at a given depth at each site ranged from 8 to 11. In each 10-meter segment, the projection of everything under the tape was recorded with an accuracy of one centimeter. Live corals (hard corals and soft corals) and other invertebrates were identified to the genus level, and if possible, to the species level. The substrate type under the measuring tape (exposed rock, sand, gravel, dead corals, etc.) was also recorded for each segment.
Coral colonies under the measuring tape were divided into four size groups, and the percentage of living tissue for each colony was estimated and recorded. The four size groups are <5 cm, 5-15 cm, 15-30 cm, and >30 cm (S, M, L, and H, respectively). For each coral under the tape, an estimate of the percentage of living tissue was made, considering the entire colony area. The health index (HI) of each site is defined as the average percentage of living tissue of all colonies measured at that site. A sample site is defined as a combination of geographical location and depth. For each site, the following parameters were measured: percentage cover of live corals, sand, and rock, coral diversity and species richness, coral health, and colony size distribution. Species diversity was calculated using the Shannon Wiener index (Equation B1), where Pi is the proportion of colonies of species (or genus) i out of the total n species (or genera) counted.
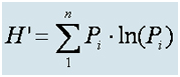
Diversity Index
This diversity index was chosen because it was the metric used by coral reef surveyors in Eilat in the past (Loya, 1972), allowing for a comparison between the data collected under the monitoring program and the data collected previously. The statistical analysis was done using JMPIN 5.0.1 software (SAS, NC USA). In all cases where error bars appear, they represent the standard error.
Photography of Fixed Sites
Objective
A long-term monitoring of changes in the number of coral colonies, their size, and health at fixed coral reef sites from the northern shore to the Egypt border.
Methods
Repeated photography of a fixed area at coral reef sites along the northern shore, Dekel Beach, Eilat Oil Terminal, Coral Reef Reserve, the Marine Lab, and Taba. At each site, a fixed mount was attached to a rock for the camera, at five selected points. At each point, the reef was photographed in four directions by rotating the camera on its mount. This allows for exact repetition of photographing the same area at different times. In total, four images were taken at each point, twenty images at each site, and 120 images for quantitative analysis of changes at various sites. The photography survey is conducted annually during the same season. In each image, the corals and other stationary invertebrates are counted, and the area of the corals is measured by digitizing the images. For the purpose of comparing colony area, only colonies that are clearly visible in full in both sets of images are considered. In cases where overlap between images from different years is incomplete (due to camera mount movements, changes in mount positions during the year, lighting conditions, or coral growth obscuring other corals), the data is collected but not included in the comparison between years. A quantitative comparison between consecutive photography series focuses on coral area in both years (growth), mortality, and colonization of corals, as well as total area changes (area change – including growth, mortality, and new colonization). The corals are identified to the species level where possible, and also classified by groups (branching hard corals, non-branching hard corals, soft corals, and fire corals). Data that was not used for comparison with the previous year may be used in future years. The results are presented graphically and undergo statistical processing.
Coral Community in the Coral Reef Reserve Lagoon
Objective
Estimate the impact, community structure, and substrate types in the southern part of the Coral Reef Reserve Lagoon (closed to visitors).
Methods
The coral community components surveyed in the lagoon include hard corals, soft corals, and invertebrates. The seafloor substrate was divided into sand and gravel (unconsolidated substrate), rock, and reef. Due to the low number of corals, the transect method was unsuitable for the lagoon survey. Instead, a 1x1 meter square sampling unit was used. The squares were placed systematically along a measuring tape laid perpendicular to the shore (hereafter referred to as the "sampling line") starting 9 meters from the shoreline to the reef edge, with a distance of 5 meters between each square, but no more than six squares along the sampling line. The "shoreline" was defined as the clear point where beach rock is covered by macroalgae. This line marks the water level at the spring low tide. Sampling lines were laid along the southern shore of the Coral Reef Reserve from the boundary between the open area and the closed visitor area, and about 400 meters south (up to about 50 meters north of the underwater observatory). At each square, corals were counted and identified to genus or species level. A visual estimate of the percentage cover of live corals and the type and percentage of substrate was recorded.
Mobile Invertebrates Survey
Objective
Estimate the population of main mobile invertebrates in the coral reef on the southern shore.
Methods
The mobile invertebrate survey was conducted at night, as most mobile invertebrates hide during the day. The survey focused on coral reefs at the Marine Lab and Coral Reef Reserve (in the closed visitor area) at depths of 5 and 10 meters (same as the depths where coral transects are conducted). The counting began one hour after sunset, after the invertebrates left their shelters to forage for food. A 100-meter measuring tape was laid along the desired depth line from a random point, and a 1 square meter sampling unit was placed at intervals of 5 meters between samples. All mobile invertebrates (echinoderms and mollusks) were counted in each square.
Metabolic Function of the Coral Reef
Objective
Evaluate the metabolic function of the reef, productivity, and total calcification, based on chemical measurements in lagoon waters.
Methods
Lagoon water was sampled using a Niskin bottle from a fixed point in the southern part of the Coral Reef Reserve. Water samples were taken at the beginning and end of the sampling day (before sunrise and just before sunset), typically on Mondays and Wednesdays every week. Measurements of alkalinity, pH, dissolved oxygen, nitrite, nitrate, and chlorophyll concentrations were made. Most chemical components affected by photosynthesis, respiration, and calcification processes in the reef show extreme values at the beginning and end of the day. For example, dissolved oxygen and pH values during the daily cycle are lowest at the end of the night and highest in the afternoon. At the end of the night, alkalinity in the reef is high (similar to open sea values) and lower than this value in the afternoon. The decrease in alkalinity during the day is due to the precipitation of CaCO3, primarily by reef-building corals and calcifying algae. Data processing uses multi-year average values of temperature and salinity. The chemical and physical measurements in the lagoon are used to calculate water turnover in the reef, the carbonate system chemistry, and various indices to evaluate metabolic function in the reef. Using measurements of dissolved oxygen, alkalinity, and pH, the environmental parameter (REP – Reduced Environmental Parameter) and the Calcifier Cover Index (CCI) are calculated. The environmental parameter provides an estimate of the ratio between the rate of CaCO3 deposition and the tropical status of the reef. The deposition rate is expressed as the average difference in alkalinity between the minimum (afternoon) and maximum (morning) values in the reef compared to the open sea alkalinity value (from coastal sampling and expeditions). The tropical status of the reef is expressed as the ratio between the maximum (afternoon) and minimum (morning) dissolved oxygen differences compared to the open sea value. The CCI is related to the rate of calcium carbonate deposition and the saturation state of aragonite in the reef waters. The saturation state of aragonite depends on the carbonate ion concentration, which is calculated using pH and alkalinity values combined with salinity and temperature. Below are the formulas for calculating REP and CCI (the CCI calculation formula differs from the one presented in the 2004 monitoring report).
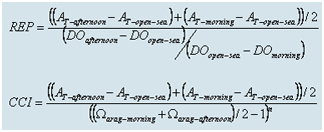
The exponent n in the CCI formula represents the order of the calcium carbonate (CaCO3) precipitation reaction, with values of 2.1 in winter and 3.2 in summer (Silverman, 2005). This formula is used to assess the activity level of calcium carbonate precipitating organisms in the reef system through the carbonate system. The ratio between the daily standard deviation of alkalinity in the reef and the daily average of aragonite saturation, raised to the power of n, serves as a measure of the activity of reef-building organisms. The rate of skeleton deposition in corals is directly related to the conditions of the carbonate system (Langdon et al., 2003; Silverman et al., 2004).
The seasonal change in calcification dependency on saturation levels between winter (higher nutrients) and summer (lower nutrients) is likely due to increased dissolution of calcium carbonate in the reef during winter or possibly due to nutrient enrichment affecting reef-building corals.
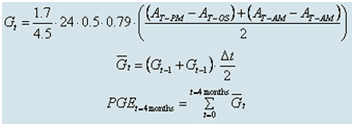
The calculation of the average daily change in alkalinity is done by multiplying the difference in alkalinity between the reef and the open sea by constant factors. For example:
-
0.79 for the daily standard deviation of alkalinity,
-
24 to convert from daily to daily averages,
-
1.7 for the average reef depth,
-
4.5 representing the average residence time of water in the lagoon.
To calculate the amount of calcium carbonate deposited, the daily change in alkalinity is multiplied by 0.5 to obtain the value for the daily deposition.
Subsequently, to reduce calculation errors, an accumulated growth rate (integral of the calculated rates) is computed over a period of 4 months, typically between 20 to 30 measurements.
The saturation degree depends on temperature and pH, and is also influenced by the mixing depth during the winter period, as well as differences between photosynthesis and respiration within the coral reef community. These factors have a complex mutual influence. During winters with a deeper mixing depth, a significant increase in dissolved carbon concentration in the surface waters causes a decrease in the aragonite saturation. Since gas exchange with the atmosphere is a slow process, this condition is maintained during the stratification period. The decrease in temperature during winter contributes to a reduction in the saturation degree, however, the enrichment of surface waters with nutrients from deeper waters leads to an increase in productivity, and thus an increase in the saturation degree.
Macroalgae Growth on the Reef
Objective:
To estimate the settlement and growth rates of benthic algae and the importance of grazing in regulating the algae biomass.
Methods:
Six arrays of two adjacent PVC plates, each 10x10 cm, were placed randomly at depths ranging from seven to ten meters on the reef in front of the Interuniversity Institute. Three arrays were covered with metal cages with a mesh size of 1x1 cm, and three were exposed. The plates serve as a substrate for the settlement of benthic algae and as a model for algae settlement on exposed reef areas. Once a month, one plate from each array was replaced alternately with a clean plate, with each plate remaining in the water for about two months. Algae were scraped from the plates removed from the water and filtered using GF/A glass fiber filters. The filters were soaked in a solution of acetone: methanol (50:50 v/v) to extract the photosynthetic pigments used to estimate algae biomass. Light absorption at the appropriate wavelengths for the photosynthetic pigments (E664, E647, E630) was measured with a Spectrophotometer and used to calculate the amount of chlorophyll a, the primary pigment in these algae, using the following equation:
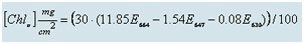
The plates protected by the metal cages serve to estimate the potential algae biomass, as the cages prevent grazing by fish, sea urchins, and large snails, which are the primary consumers of these algae. The growth potential of algae is largely controlled by the availability of nutrients in the water. The exposed plates serve as a measure of the actual algae biomass, and thus the extent of grazing on the algae. Due to the high variability in algae biomass (i.e., chlorophyll a concentration) on the experimental plates, each monthly measurement is calculated as the average of three protected plates and three exposed plates removed in the same month.
Monitoring the Coastal Environment
Seawater Near the Shore
Objective:
To track chemical, physical, and biological parameters in seawater near the shore and identify trends or pollution sources that may harm the coral reef community.
Methods:
Measurements of chemical and biological parameters are conducted once a month on samples from surface water at seven stations along the Israeli coastline of the Gulf of Aqaba, as well as at an open-sea station, as detailed in Table 2. Sampling is done from the boat in the morning hours. During continuous surveys, water samples are taken from a depth of 1-2 meters at eight stations using a 5-liter GOFLO Niskin bottle, for laboratory measurements. Additionally, the surface water temperature is measured using a mercury thermometer, and water turbidity is estimated by Secchi depth. The Secchi depth is measured by lowering a white disc with a fixed diameter from the boat and recording the depth at which the disc is no longer visible.
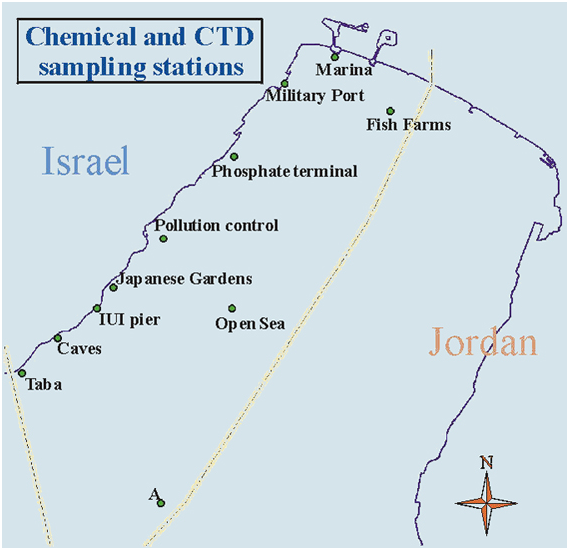
Table 2: Location and Description of Coastal Sampling Stations for the National Monitoring Project
| Station Name |
Location Description |
Latitude |
Longitude |
| FF |
Fish cages |
29º32.25' |
34º55.75' |
| NB |
Northern shore opposite Dan Hotel |
29º32.94' |
34º58.23' |
| N |
Opposite the southern tip of the Navy base, approx. 50 meters east of the cooling water discharge of the Meridian Hotel |
29º32.55' |
34º57.36' |
| PT |
Phosphate loading terminal |
29º31.76' |
34º57.09' |
| WPC |
Pollution Prevention Unit station |
29º30.87' |
34º56.54' |
| NR |
Japanese Gardens, Coral Reef Beach Reserve – seabed depth 20 meters |
29º30.33' |
34º55.78' |
| T |
Opposite the Taba border crossing |
29º29.41' |
34º54.24' |
| OS |
Open sea opposite the IUI |
29º30.11' |
34º56.52' |
Sample Collection and Chemical Measurements:
Upon returning from sampling cruises, water samples are divided for the following chemical measurements:
-
Dissolved Oxygen: The oxygen concentration is determined using the Winkler method, a titration reaction. The samples are fixed by adding MnSO4 and KI+NaOH reagents and titrated with Na2S2O3 at a concentration of N0.1. The titration is performed using an automatic titrator (Titrino 702 SM, Metrohm, Switzerland).
-
pH: Measured using a combined pH electrode (pHC2401-7) and pH meter (93 PHM, both Radiometer Copenhagen). pH is measured at a constant temperature of 25ºC.
-
Salinity: Measured using a salinity meter (2100 Minisal, AGE Instruments, Canada).
-
Nutrients: NO2, NO3, SiO2, PO4 are measured using a QuikChem 8000 flow injection analyzer (Lachat Instruments, USA). The measurement is based on the color reaction between each nutrient and its specific reagent to form a colored complex, which is detected by the instrument’s spectrophotometer.
-
Alkalinity: Determined by Gran titration with HCl at N0.05 concentration, using an automatic titrator (DL67, Mettler Toledo, Switzerland) and a combined pH electrode (DG111).
-
Chlorophyll: Water is filtered through GFF filters and extracted with 90% acetone in the dark (at 4ºC) for 24 hours. The chlorophyll and pheophytin concentrations are measured using a 10-AU Fluorometer (Turner Designs, USA), with pheophytin measured after acidifying the extract with N1 HCl.
-
Ammonia: Measured using a DyNA QuantTM 2000 Fluorometer (Hoefer) after incubating the samples in the dark with a reagent containing orthophthaldialdehyde for 3 hours.
-
Phytoplankton Cell Count: Conducted using a FACScan system (Becton Dickinson) to count cells and separate them by size and pigment content using flow cytometry. The water sample is passed through a laser beam, breaking up the cells and collecting information about their size, shape, and pigment absorption.
Monitoring the Seabed:
Objective:
To monitor the process of eutrophication in the bay by measuring the organic material accumulation on the bay's seabed.
Methods:
Sediment from the seabed is collected using a grab sampler at stations along the shore where the seabed depth is 20 meters. The sediment is sampled using syringes as core samplers (3 cores per grab). A 1 cm thick slice of the top sediment is cut from each core. The samples are dried at 105ºC for 24 hours, then burned at 450ºC for 4 hours. The amount of organic material in each sample is determined by the weight difference before and after burning. The percentage of organic material in the top sediment is calculated for each site.
Monitoring Open-Sea Water:
Objective:
To monitor chemical, physical, and biological variables in open-sea water and identify trends in water characteristics.
Methods:
Water samples are collected during monthly cruises at three stations in the northern bay. Station A, open-sea station (OS), and near the fish cages in the northern bay. Station A is located at the southernmost point of Israel’s territorial waters in the Gulf of Aqaba, at a seabed depth greater than 700 meters. The open-sea station is located about 4 km south of the northern shore, with a seabed depth of about 400 meters. The station near the fish cages has a seabed depth of about 55 meters. Water samples are taken from different depths using a 'rosette' with 11 Niskin bottles (10 liters) and a CTD (conductivity, temperature, depth) instrument. The samples are taken by closing the bottles at desired depths during the cruise. At Station A, two casts are taken (deep and shallow) for higher resolution of samples around the thermocline and upper water column. The sampling depths are adjusted based on real-time temperature, salinity, and fluorescence data from the CTD during each cruise.
Continuous Measurements:
Chlorophyll near the Reef:
Objective:
To monitor long-term changes in phytoplankton biomass in the coral reef reserve.
Methods:
Daily measurement of chlorophyll a concentration in surface water as an indicator of phytoplankton biomass. Two 300 ml water samples are collected each morning between 8-9 am from a fixed point at the underwater observatory pier, just outside the reef. The water is filtered on-site through a 100mm mesh to remove zooplankton and brought to the lab for chlorophyll measurement.
Water Temperature at the Coral Beach Reserve:
Objective:
To monitor long-term surface water temperature changes.
Methods:
The surface water temperature is measured daily at the coral reef reserve pier using a mercury thermometer accurate to 0.1ºC.
Current Measurements:
Objective:
To monitor the direction and intensity of the current near the coast.
Methods:
An Acoustic Doppler Current Profiler (ADCP, 600 kHz) is placed on the slope in front of the Inter-University Institute at a depth of 30 meters and oriented upwards. The device samples the current direction and speed every 10 minutes in 1-meter layers, from depths of 3 to 27 meters. Data processing includes removing outliers (2 * standard deviation).